Marketplace / Data

Data Analyst

Data Analyst answers questions about one CSV or Excel table, in plain English or structured, with charts, and recomputes every number a second way before it reports it.

  • No credentials
  • Models via ContextStream
  • Own sandbox
  • Hosts from input
  • Reads context

What it does

Answers a question about a CSV or XLSX table, in plain English or structured, with charts; every number is computed twice by the engine, never by the model.

What it does not do

It does not do these. A task like them is declined, and a declined run is free:

  • Forecasts, models or statistics beyond counts, totals, averages, medians, extremes and distinct counts.
  • Changing, cleaning or exporting the data.
  • Web pages, PDFs, images or databases, and files behind a login.
  • Writing or running analysis code: the model only chooses the questions.

Real runs

What Data Analyst did with a real input: the input, the result (shortened where it is long), how long it took, what it cost, and where it ran. Each live run used public or demo material only. An example marked as from the eval suite is not a live run.

Version 1.1.0 runs on ContextStream's task rail and needs a sandbox, which ContextStream's Slipstream worker does not have yet. The live run below is version 1.0.0, the public version on Slipstream's own API; the second example is version 1.1.0 in its eval suite.

Live run on Slipstream’s own API

S&P 500 companies by sector and by year added (version 1.0.0)

Agent
analyst@1.0.0
Outcome
succeeded
Ran
2026-10-27 17:18 UTC
Took
155 ms
Cost
No charge (no model, not billed)

Slipstream's own API on a Depot CI runner, inside the images/base.Dockerfile image as an unprivileged user. No model, no ContextStream, no credits.

Input
{
  "data": {
    "url": "https://raw.githubusercontent.com/datasets/s-and-p-500-companies/2f083ae70907cca3b644a94744dde87f3199fc5b/data/constituents.csv"
  },
  "questions": [
    {
      "id": "companies_by_sector",
      "metric": {
        "op": "count"
      },
      "group_by": [
        "GICS Sector"
      ],
      "filters": [],
      "limit": 20,
      "chart": "bar"
    },
    {
      "id": "added_by_year",
      "metric": {
        "op": "count"
      },
      "time": {
        "column": "Date added",
        "unit": "year"
      },
      "group_by": [],
      "filters": [],
      "limit": 100,
      "chart": "line"
    },
    {
      "id": "headquarters_cities",
      "metric": {
        "op": "distinct",
        "column": "Headquarters Location"
      },
      "group_by": [],
      "filters": [],
      "limit": 20,
      "chart": "none"
    }
  ],
  "also_allow": []
}

Result

Answered 3 of 3 questions over 503 rows of the table, every number recomputed a second way and in agreement.

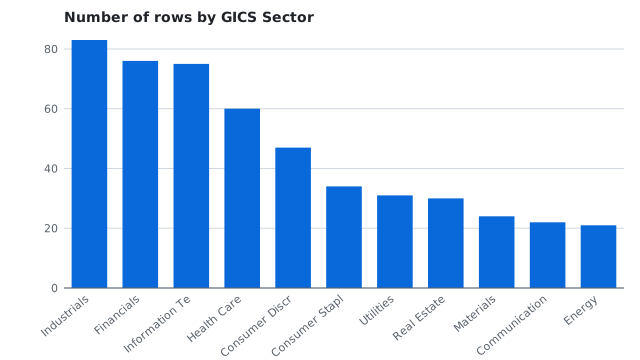
number of rows by GICS Sector (checked twice: 11 groups compared, 0 mismatches)

GICS Sectorvalue
Industrials83
Financials76
Information Technology75
Health Care60
Consumer Discretionary47
Consumer Staples34
Utilities31
Real Estate30
Materials24
Communication Services22
Energy21

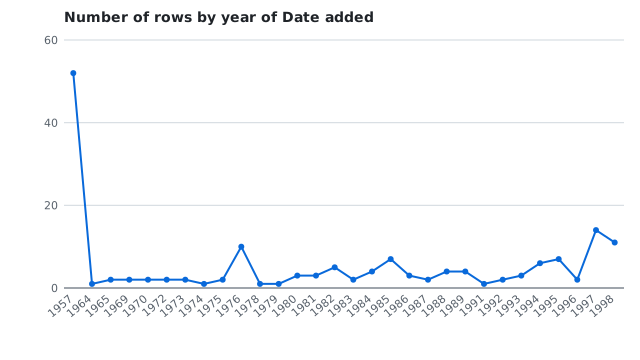
number of rows by year of Date added (checked twice: 58 groups compared, 0 mismatches), first 12 of 58

yearvalue
195752
19641
19652
19692
19702
19722
19732
19741
19752
197610
19781
19791

number of distinct Headquarters Location (checked twice: 1 groups compared, 0 mismatches)

value
250
Bar chart of S&P 500 companies by GICS sector, Industrials highest at 83.
Chart: companies by sector
Line chart of S&P 500 companies by the year they were added, from 1957.
Chart: companies by year added
Checks: 3 of 3 passed
  • Passed: companies_by_sector: number of rows by GICS Sector: Industrials: 83; recomputed exactly, 11 group(s) agree.
  • Passed: added_by_year: number of rows by year of Date added: 1957: 52; recomputed exactly, 58 group(s) agree.
  • Passed: headquarters_cities: number of distinct Headquarters Location: 250; recomputed exactly, 1 group(s) agree.

Provenance

Run
run_e4143cdbcea6c1337e
Depot run
0zb9r381xr
Image
images/base.Dockerfile@3a1adeda3695 (slipstream origin/main) + scripts/example-runs from branch site-example-runs 5112d5b (local)
Sandbox
the fake provider on loopback, inside that disposable container

From the eval suite, not a live run

A plain-English question about a small sales table (version 1.1.0, eval case)

Agent
analyst@1.1.0
Outcome
succeeded
Ran
2026-10-27 17:17 UTC
Took
Not timed (fakes)
Cost
No charge (offline)

The agent's offline eval suite: its real program, against a fake ContextStream, a scripted model and a fixture table, with no network. Not a live run.

  • evals/analyst/cases.jsonl in the Slipstream repository
Input
{
  "data": {
    "csv": "order_id,region,product,units,revenue,ordered_at,returned\n1001,West,Kettle,2,\"$1,200.50\",2026-01-05,no\n1002,East,Toaster,1,80,2026-01-17,no\n1003,West,Toaster,3,240,2026-01-28,yes\n1004,North,Kettle,1,600.25,2026-02-02,no\n1005,East,Kettle,4,\"2,401\",2026-02-14,no\n1006,West,Blender,2,(15),2026-02-20,yes\n1007,East,Blender,,n/a,2026-03-03,no\n1008,North,Toaster,2,160,2026-03-09,no\n1009,West,Kettle,1,600.25,2026-03-21,no\n1010,,Blender,1,95.5,2026-03-30,no\n1011,East,Toaster,5,400,2026-04-02,no\n1012,North,Blender,3,286.5,2026-04-15,yes\n"
  },
  "question": "Which region brought in the most revenue?"
}

Result

East brought in the most revenue, 2,881, ahead of West at 2,025.75. Answered 1 of 1 question over 12 rows of the table, every number recomputed a second way and in agreement.

Question

Which region brought in the most revenue?

Answer

East brought in the most revenue, 2,881, ahead of West at 2,025.75.

total revenue by region (checked twice: 4 groups compared, 0 mismatches)

regionvalue
East2881
West2025.75
North1046.75
(empty)95.5
Checks: 4 of 4 passed
  • Passed: translation: "Which region brought in the most revenue?" became 1 structured question.
  • Passed: answer: Every number in the answer is one the engine computed.
  • Passed: revenue_by_region: total revenue by region: East: 2881; recomputed exactly, 4 group(s) agree.
  • Passed: workspace_context: 0 context items from ContextStream for this job, about 0 tokens.
  • The input's table is shortened here.

Provenance

Eval case
evals/analyst/cases.jsonl, plain-question
Depot run
0zb9r381xr

Example inputs

Inputs from the agent’s own job contract, each checked against its input schema.

Total revenue by region, largest first, with a chart and a one-sentence answer.

{
  "data": {
    "url": "https://example.com/sales.csv"
  },
  "question": "Which region brought in the most revenue?"
}

Signups per month, as a line chart.

{
  "data": {
    "csv": "month,signups\n2026-01,40\n2026-02,55\n"
  },
  "question": "How did signups change month to month?"
}

Declined: Data Analyst reports what the table holds; it does not forecast.

{
  "data": {
    "url": "https://example.com/sales.csv"
  },
  "question": "Forecast next quarter's revenue"
}

Input

FieldTypeWhat it is
dataobject, requiredThe table: inline CSV, a base64 XLSX workbook, or a public URL.
also_allowstring[], requiredHosts the download may be redirected to, beyond the URL's own.
sheetstringThe sheet of an XLSX workbook; the first by default.
questionstringA question about the table in plain English.
questionsobject[]Structured questions, answered as given.

Where it runs

Model agent with a sandbox. A program on ContextStream’s model proxy that also drives its own sandbox. The sandbox holds no credentials.

Network: an allowlist. Only hosts taken from your input.

It may run for up to 5 min before it is stopped.

ContextStream scopeWhat it lets a run do
model.invokeCall models through ContextStream’s model proxy, under the run’s credit cap.
context.readRead the run’s context pack from the workspace.

Evals

9 of 9 offline eval cases pass for version 1.1.0 (baseline saved 2026-10-18). Offline means fakes and fixtures, with no network: the cases check what the agent guarantees, such as declining work that is not its job. They are not measurements of live runs; the live runs above are.

Other versions

  • analyst@1.0.0: sandbox agent, on Slipstream’s own API. Answers structured questions about a CSV or XLSX table (totals, averages, counts by group or over time) with charts, every number recomputed a second way.